Somewhere in Windhoek right now, a lender is reviewing a project appraisal for a solar plant in the ||Karas region. The climate risk section cites a global hazard model. That model was calibrated against observation networks where a weather station sits within 20 kilometres of almost any asset. The nearest long-record station to this site is more than 150 kilometres away. Nobody in the room knows this.
This is not an edge case. It is the standard condition for infrastructure lending across most of Namibia and across large stretches of sub-Saharan Africa. The climate risk assessments that development finance institutions (DFIs) rely on were not designed for the data environment they are operating in. The models are not wrong. They are the right models applied in the wrong place.
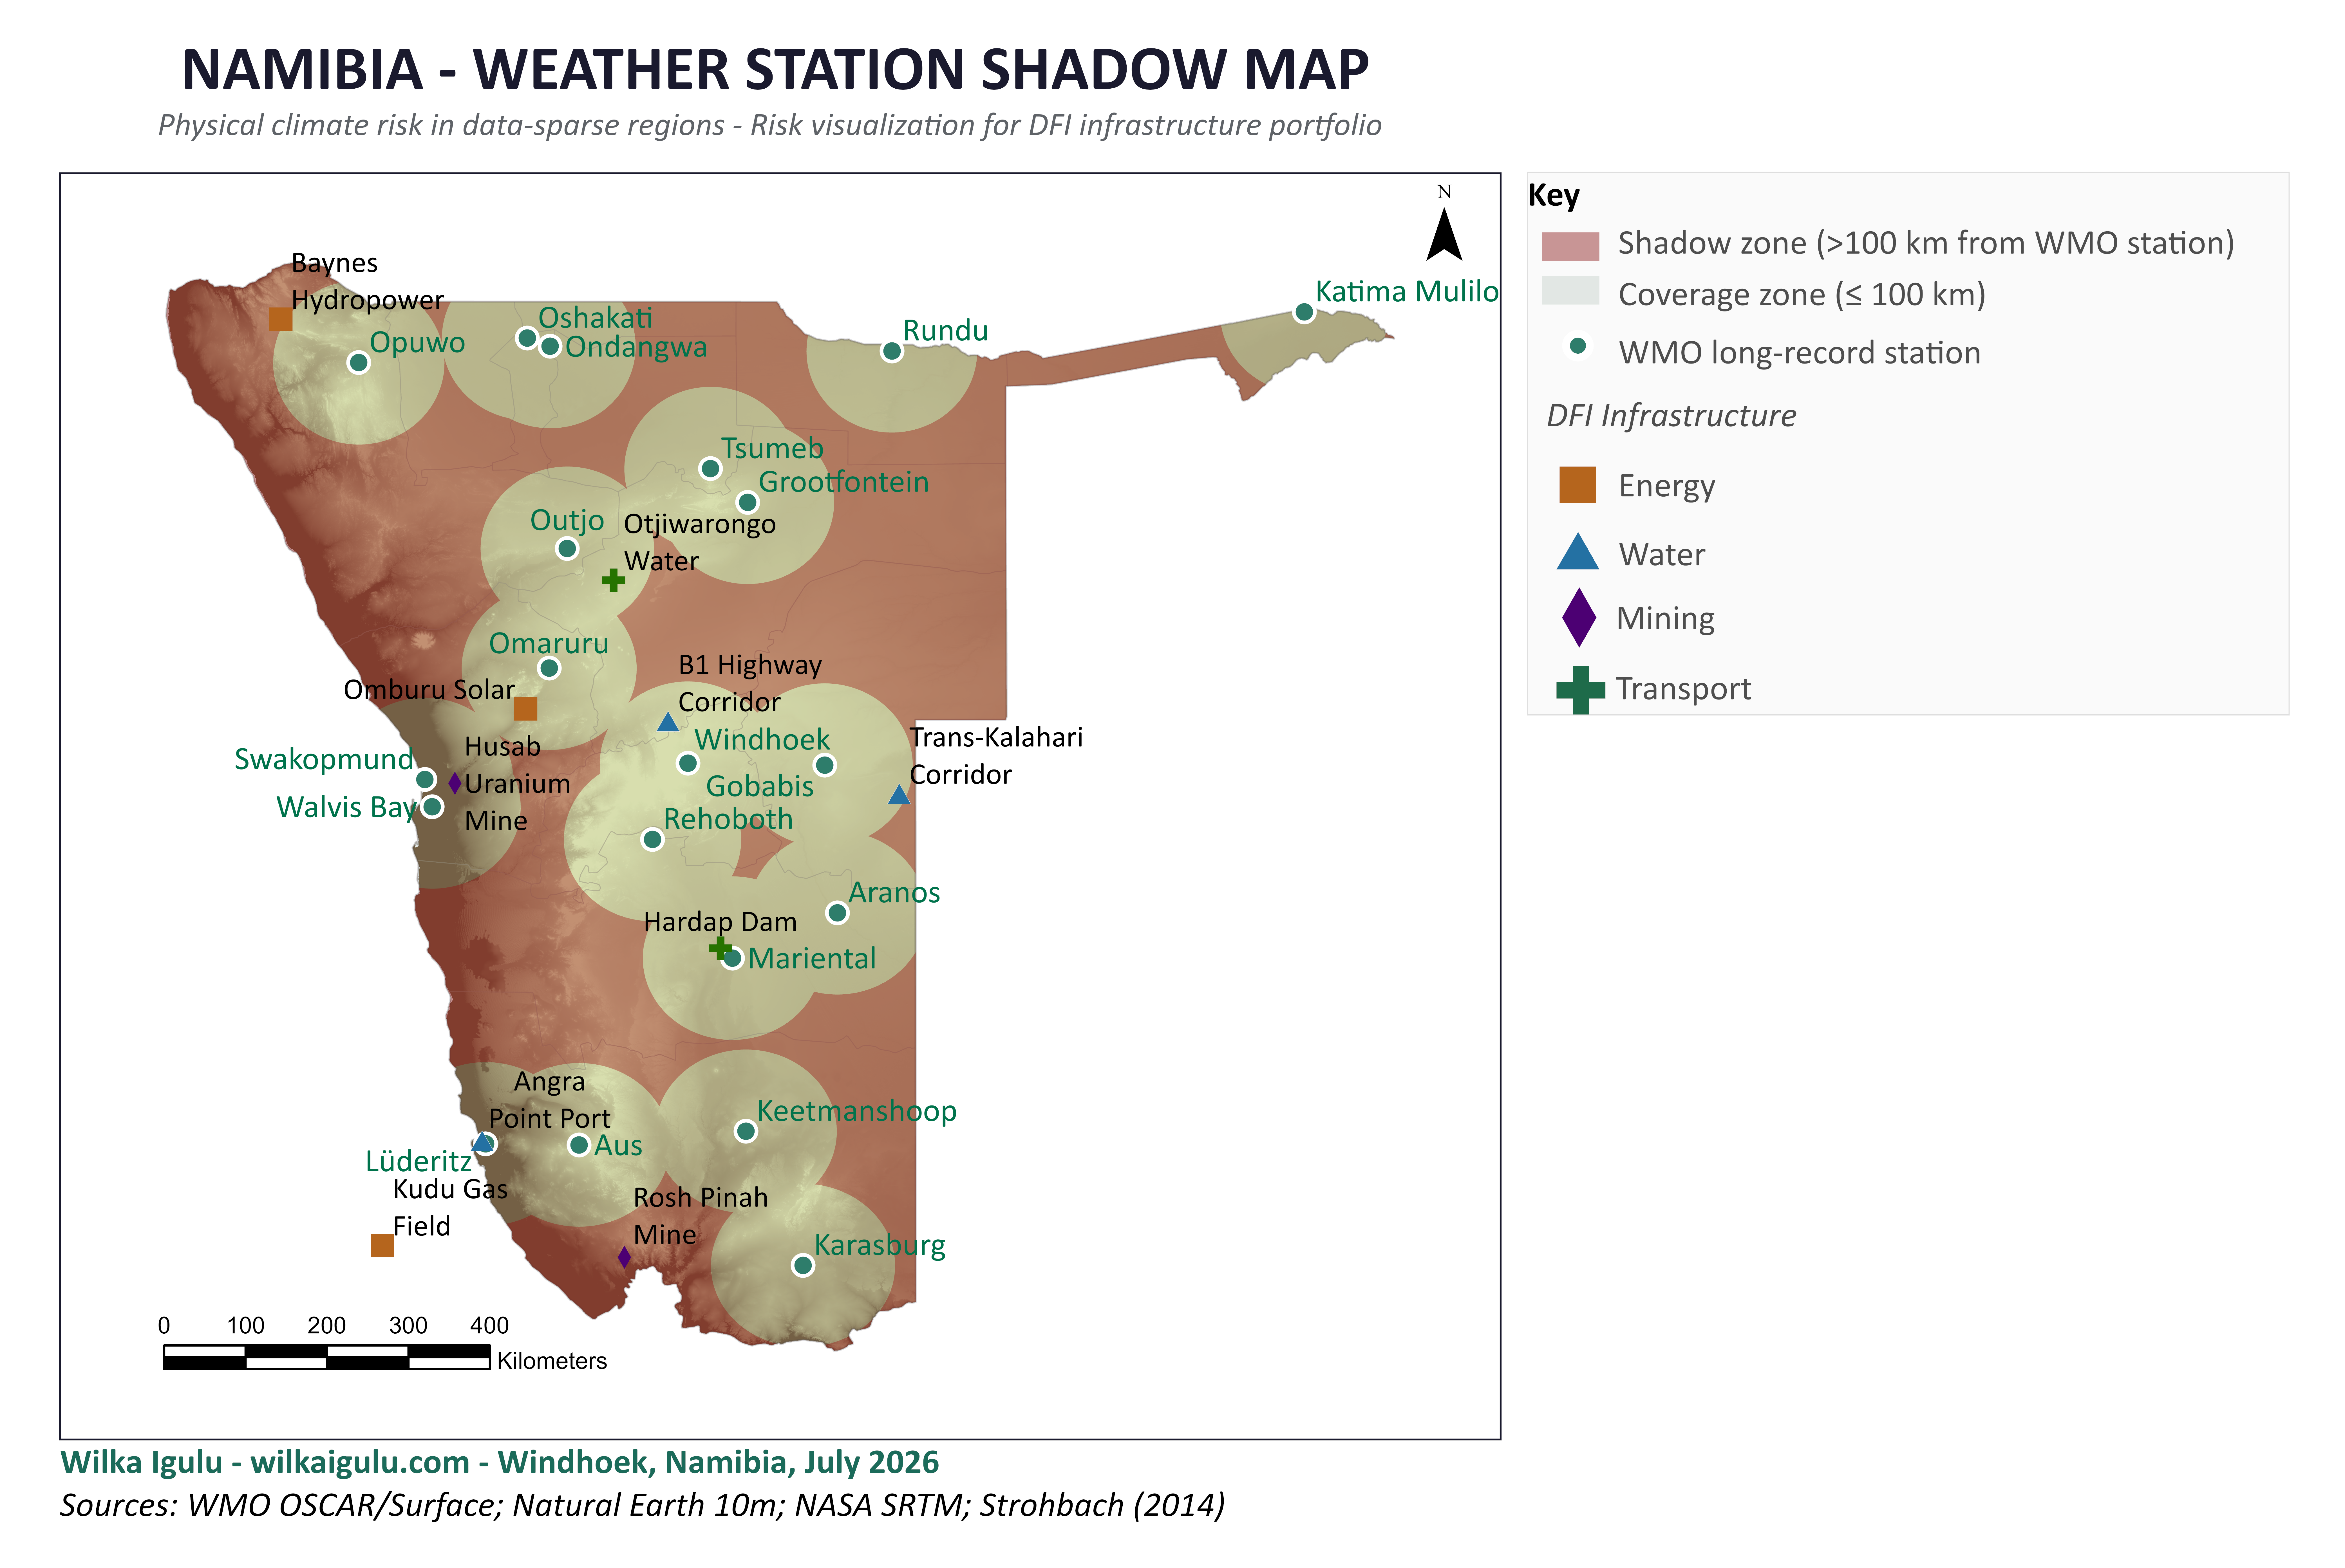
The density gap
Namibia covers 825,615 km². Depending on which counting method you use, it has between roughly 20 and 127 weather stations and the difference between those two numbers matters more than the range suggests. The higher figure, drawn from the WMO registry, counts stations that are formally registered, including private and tourism-lodge installations that are intermittent, non-standard, or not transmitting data to any international exchange. The lower figure reflects the stations that have operated continuously, at WMO-standard instrumentation levels, for long enough to generate the historical baselines that climate risk models actually require. Through the BIOTA project (2000–2009), 21 high-end stations meeting WMO standards were deployed, and the Ministry of Agriculture, Water and Forestry added 17 more on its research stations; an additional 14 private and tourism-lodge stations also operate, though at varying technical standards (Strohbach, 2014). For the purpose of DFI infrastructure lending which depends on hazard return periods, long-run trend analysis, and site-level validation, it is the lower figure that defines the real operating environment.
The shadow map above makes this visible. The dark red-brown wash covers the areas of Namibia that fall more than 100 km from the nearest WMO long-record station, a 100 km radius being the per-station footprint implied by the WMO's own minimum spacing standard of one station per 200 km. What is striking is not the size of any individual gap, but the proportion of the country it covers: approximately 64% of Namibia's land area lies in the shadow zone. The coverage circles cluster along the central corridor and the north, leaving the southeast, the ||Karas region, and large parts of Kavango and Zambezi without meaningful ground observation.
The contrast with observation-dense countries is significant and it is worth being precise about the arithmetic, because the honest version is also the stronger one. The United Kingdom's Met Office operates more than 350 stations across 244,000 km², roughly one per 700 km² typically spaced about 40 km apart (Met Office, 2025). Germany's Deutscher Wetterdienst maintains approximately 2,000 stations across 358,000 km², roughly one per 180 km² (DWD, n.d.). Count every registered Namibian station generously all 127 of them and the density is one per 6,500 km²: nine times sparser than the UK, thirty-six times sparser than Germany. Count only the long-record stations that DFI-grade hazard modelling actually requires roughly 20 and the density falls to one per 41,000 km²: sixty times sparser than the UK, two hundred and thirty times sparser than Germany. The models were validated at the top of that range. They are being applied at the bottom.
Africa's GBON (Global Basic Observing Network) station count increased from 589 to 1,045 surface stations between January and June 2023 an improvement, and a sign of political will (WMO, 2025). But the WMO's minimum spacing standard is itself a floor, not a solution: reaching it across Namibia's terrain would still leave each station responsible for a vast area.
One long-record station per 41,000 km² is not a monitoring gap. It is the absence of a monitoring system.
What the archive actually contains
The register counts above are what the paperwork says. In June 2026 I tested what the data says, by pulling every Namibian station record available in NOAA's Global Historical Climatology Network the archive that global risk models and reanalysis products ultimately lean on for this region (Menne et al., 2012) and auditing each record for length, completeness, and usability.
The findings were worse than the register implies. Of ten resolvable stations, only three carry usable records from 1970 to the present: Windhoek, Rundu, and Gobabis. Ondangwa the gateway station for the country's most densely populated region has data for 35% of expected days and is missing the entire 1990s. Walvis Bay, the national port and industrial corridor, has precipitation records for 6.6% of days since 1990. And Lüderitz, a coastal town with more than a century of settlement history and a working harbour, appeara in the NOAA ISD station history under two entries dating to 1949 but both GHCND station files return HTTP 404. Registered in the global metadata. Absent from the archive that matters.
That last finding deserves a moment. When the international archive underpinning global climate risk tools contains no record at all for a town of Lüderitz's standing, the problem is no longer statistical nuance. Any hazard estimate a global model produces for the southern Namibian coast is being generated, at best, from stations hundreds of kilometres away and from model physics and the deliverable will not say so. The full station audit, with per-station quality scores, is published openly (Igulu, 2026; DOI: 10.5281/zenodo.21229782).
What the models assume
The standard tools used to assess climate risk in DFI project appraisals, global flood models, CMIP6-based hazard datasets (CMIP6: the Coupled Model Intercomparison Project Phase 6, a coordinated set of global climate simulations), and the proprietary platforms assessed in the UNEP FI Climate Risk Landscape (UNEP FI, 2021) were built on dense observation networks. Their developers validated them against European, North American, and East Asian data environments where stations are close together, records are long, and uncertainty can be bounded with some confidence.
Many of the most widely used CMIP6 global climate models operate on grid cells of approximately 100–250 km in resolution, with each cell covering 10,000 km² or more (Eyring et al., 2016). Higher-resolution variants exist, but they are computationally expensive and rarely the models behind the commercial DFI risk platforms that practitioners actually use. In Namibia, a single standard-resolution grid cell can contain no weather station at all. The model produces a confidence interval, but that interval is computed as if the underlying observational density were comparable to the contexts in which the model was validated. It is not. The result is not high uncertainty, it is false precision. The outputs look like estimates. They are extrapolations.
Much of the existing research on climate risks in energy systems and infrastructure is concentrated in developed nations, offering limited insight into the challenges faced by developing regions (Li, Gallagher & Chen, 2026). That gap in the research record compounds the gap in the observational data. When DFI analysts reach for academic literature to validate a methodology, the literature they find was often not produced for their context either.
The financial consequence
This is not a technical nuisance. It has a direct cost. A 2024 study published in Nature Communications quantified what happens when asset-level geographic precision is stripped from climate physical risk assessments. The authors found that investor losses were underestimated by up to 70% when asset-level location information was neglected, and by up to 82% when tail acute risks extreme flood and hurricane events were excluded from the model (Bressan, Đuranović, Monasterolo & Battiston, 2024). The study focused on Mexico a materially better-observed country than Namibia. Where locational precision is structurally limited, loss estimates will systematically undercount risk, Namibia's station network makes that limitation structural.
The regulatory frameworks that DFIs must now navigate have made this more consequential, not less. The EU's CSRD, in force since 2023 with climate risk disclosure required from 2025 onwards, mandates double materiality assessment at the asset or site level, not just at portfolio level (European Parliament & Council, 2022). The TCFD framework, now embedded in the ISSB's IFRS S2 standard, requires that physical risk disclosures be meaningful, traceable to actual hazard data at the relevant resolution (TCFD, 2017; ISSB, 2023). In regions where monitoring infrastructure is thin, the underlying data may simply not exist in the form the framework requires. Auditors can accept documented data gaps; they cannot accept undocumented ones (SmartResilience, 2026).
This creates a specific exposure for lenders active in southern Africa. If the data gap is not documented, the disclosure fails audit scrutiny. If it is documented, it raises questions about whether the deal's risk pricing was adequate. Neither outcome is comfortable.
What a better approach requires
The solution is not to wait for a denser station network. The TAHMO initiative which aims to install 20,000 stations across sub-Saharan Africa and has installed approximately 700 in 21 countries to date, is the most ambitious attempt to close the observation gap (TAHMO, n.d.; van de Giesen et al., 2014). But even under accelerated deployment, new stations take decades to accumulate the long historical baselines that hazard modelling requires. Lenders making decisions today cannot defer to a future dataset.
The methods that can work in data-sparse environments are different from the methods that work in data-rich ones. Bayesian approaches that incorporate prior distributional knowledge where observations are scarce; spatial interpolation that is explicit about its uncertainty radius; and pipelines that propagate data quality into the confidence interval rather than absorbing it silently, these are the tools that honest risk analysis in Namibia requires. The key methodological commitment is to widen the confidence interval in proportion to the actual data quality, rather than narrowing it to match a benchmark that was not built for this context.
That requires a specific choice: to treat observation network density as a first-class input to the risk model, a measured, scored, reported quantity, not a footnote in the methodology appendix.
The disclosure problem
Until the infrastructure investment community treats observation density as a material risk factor, the confidence intervals on African infrastructure risk assessments will be wider than the estimates they bracket, whether or not anyone writes that down. That is not a modelling problem. It is a disclosure problem.
A global hazard model run over a Namibian asset produces a number. That number goes into a project appraisal, informs a loan decision, and may influence an interest rate. The nearest station, 150 kilometres away, or missing from the archive altogether will not appear anywhere in that document. I am building the methodology that changes that, in the open: a data quality score attached to every risk output, an extreme value engine that adapts to what the data can support, and a full reproducible pipeline demonstrated on a real Namibian asset. The station audit is published; the framework working paper and the open-source pipeline follow it. Developing that competency is not optional for the region's infrastructure finance community. It is the next one.
References
Bressan, G., Đuranović, A., Monasterolo, I., & Battiston, S. (2024). Asset-level assessment of climate physical risk matters for adaptation finance. Nature Communications, 15(1), 5474. doi.org/10.1038/s41467-024-48820-1
DWD (Deutscher Wetterdienst). (n.d.). Surface weather observations from the measuring networks of the Deutscher Wetterdienst. dwd.de
European Parliament & Council of the European Union. (2022). Directive (EU) 2022/2464 (Corporate Sustainability Reporting Directive — CSRD). Official Journal of the European Union, L 322.
Eyring, V., Bony, S., Meehl, G. A., Senior, C. A., Stevens, B., Stouffer, R. J., & Taylor, K. E. (2016). Overview of the Coupled Model Intercomparison Project Phase 6 (CMIP6). Geoscientific Model Development, 9(5), 1937–1958. doi.org/10.5194/gmd-9-1937-2016
Igulu, W. (2026). Namibia Station Monitor: GHCND audit and Data Quality Scoring for Namibian climate stations (audit-2026-06) [Data and code]. Zenodo. 10.5281/zenodo.21229782
ISSB (International Sustainability Standards Board). (2023). IFRS S2: Climate-related Disclosures. IFRS Foundation. ifrs.org
Li, X., Gallagher, K. P., & Chen, X. (2026). Climate double whammy: Assessing the physical and transition climate risks of overseas power projects. Environmental Research Letters, 21(3), 034007. doi.org/10.1088/1748-9326/ae3848
Menne, M. J., Durre, I., Vose, R. S., Gleason, B. E., & Houston, T. G. (2012). An overview of the Global Historical Climatology Network-Daily database. Journal of Atmospheric and Oceanic Technology, 29(7), 897–910. doi.org/10.1175/JTECH-D-11-00103.1
Met Office. (2025). Weather stations. Met Office. weather.metoffice.gov.uk
SmartResilience. (2026, April). How data quality gaps undermine CSRD and TCFD compliance. smartresilience.com
Strohbach, B. J. (2014). The SASSCAL/MAWF Weather Stations Network in Namibia. Polytechnic of Namibia (now NUST). ir.nust.na
TAHMO (Trans-African Hydro-Meteorological Observatory). (n.d.). About us. tahmo.org
TCFD (2017). Recommendations of the Task Force on Climate-related Financial Disclosures: Final report. Financial Stability Board.
UNEP FI (2021). The Climate Risk Landscape. unepfi.org
van de Giesen, N., Hut, R., & Selker, J. (2014). The Trans-African Hydro-Meteorological Observatory (TAHMO). WIREs Water, 1(4), 341–348. doi.org/10.1002/wat2.1034
WMO (2023). GBON compliance criteria. In Manual on the WMO Integrated Global Observing System (WMO-No. 1160).
WMO (2025, May). Africa increases designation of GBON stations. WMO Bulletin. wmo.int