Namibia's public finances, electricity supply, drought risk and green hydrogen pipeline are reported in different places, on different schedules, in different units. I built one observatory that puts them side by side, and made it check its own numbers.
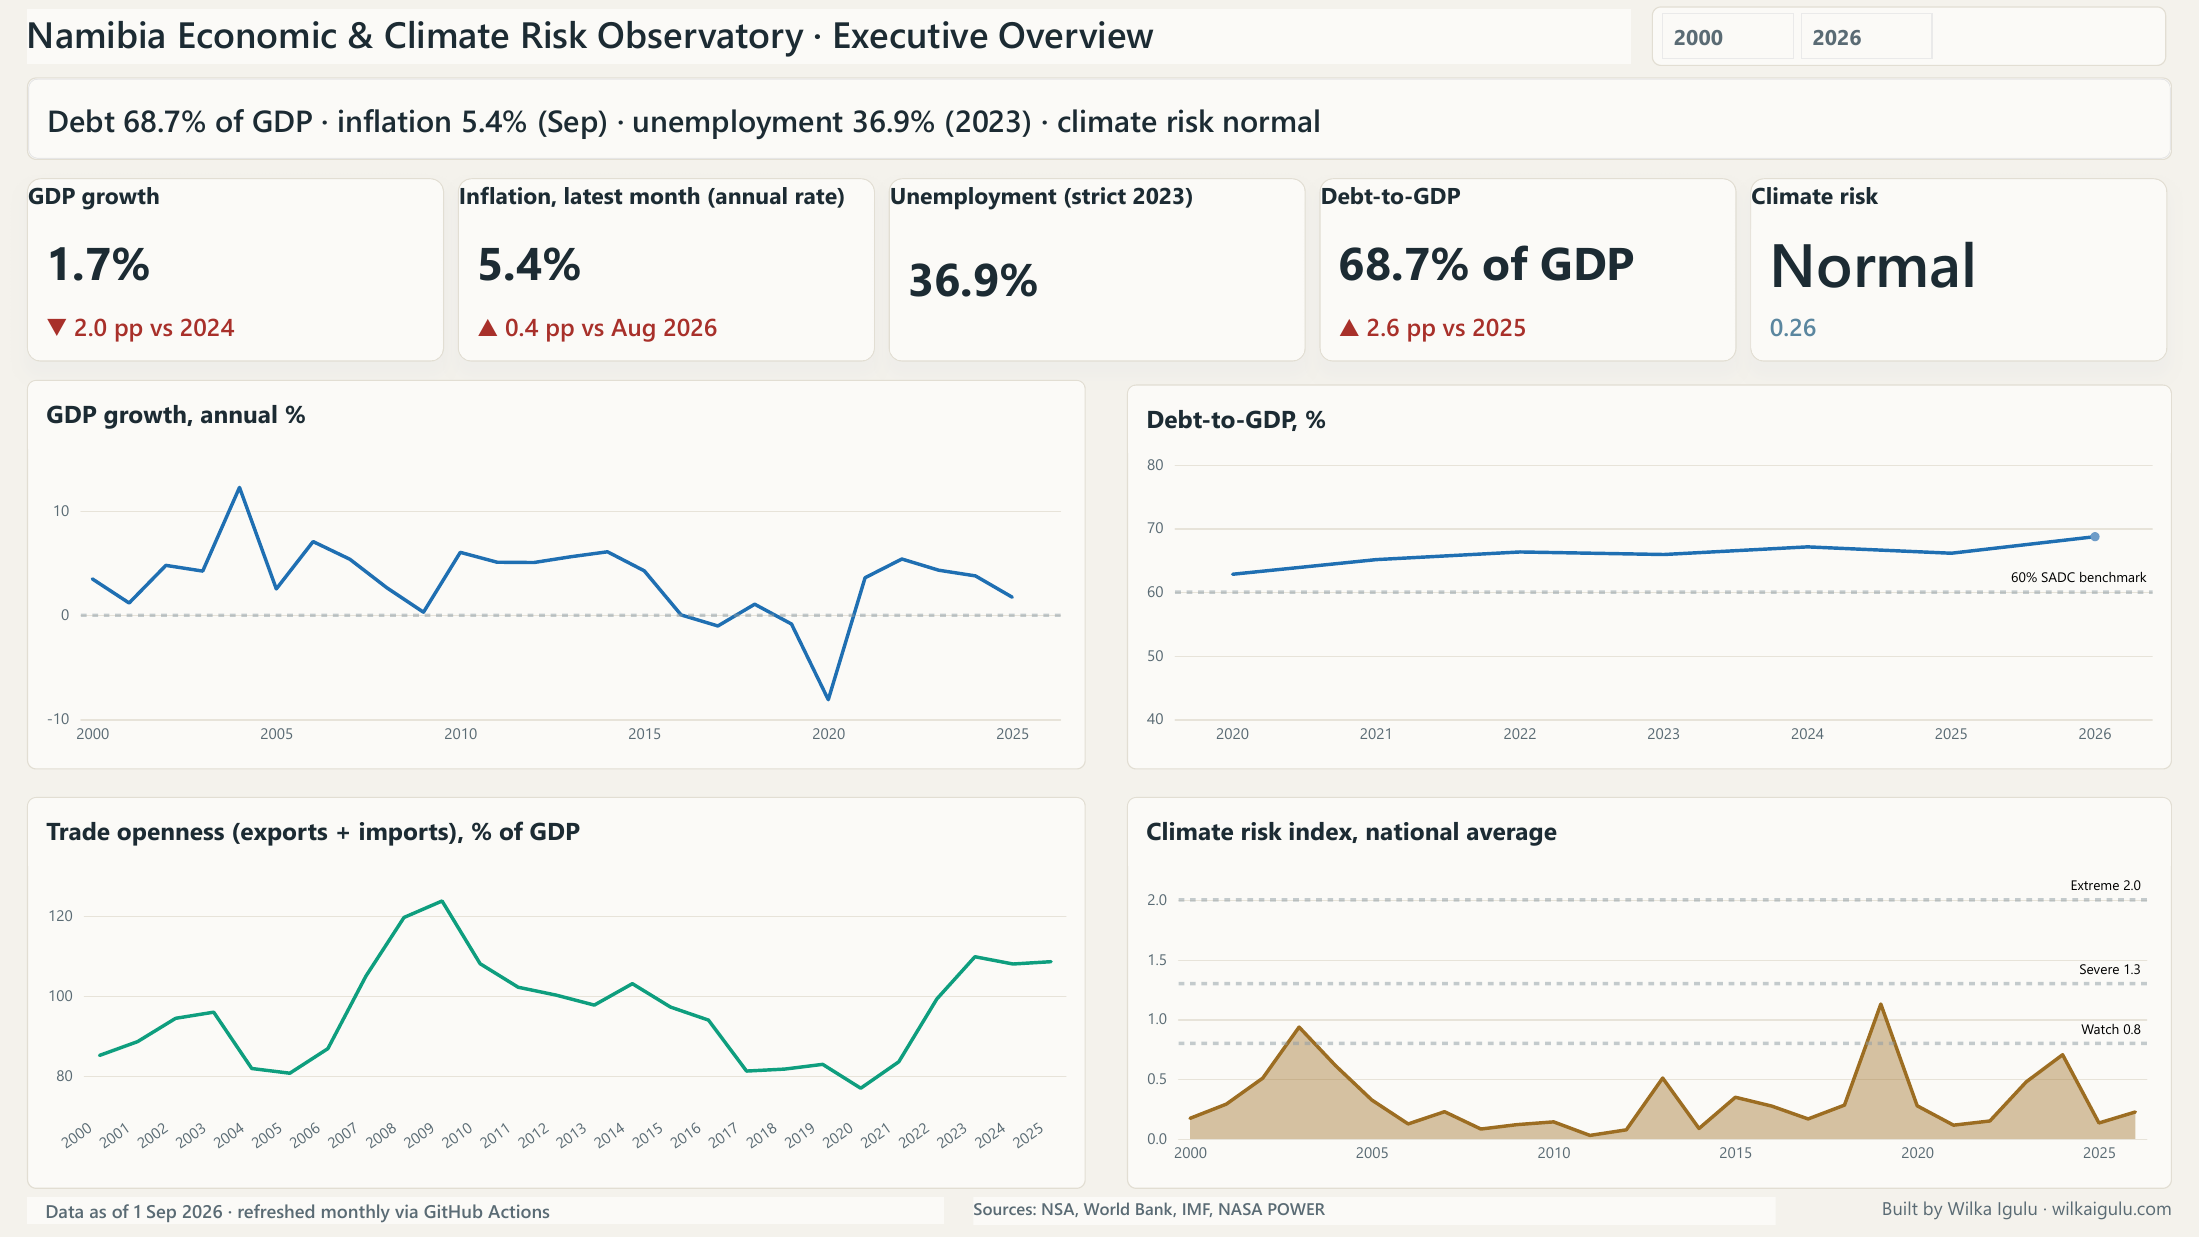
Figures on this page are as of 30 October 2026.
The question
Can the state carry its debt? What is inflation doing now that fuel prices are rising? Where is drought biting? Is the green hydrogen pipeline moving, or slipping? None of these has a single home. Each sits in a budget document, a statistics bulletin, a climate dataset or a press report, so a reader has to assemble the picture by hand.
What it shows right now
The four pages
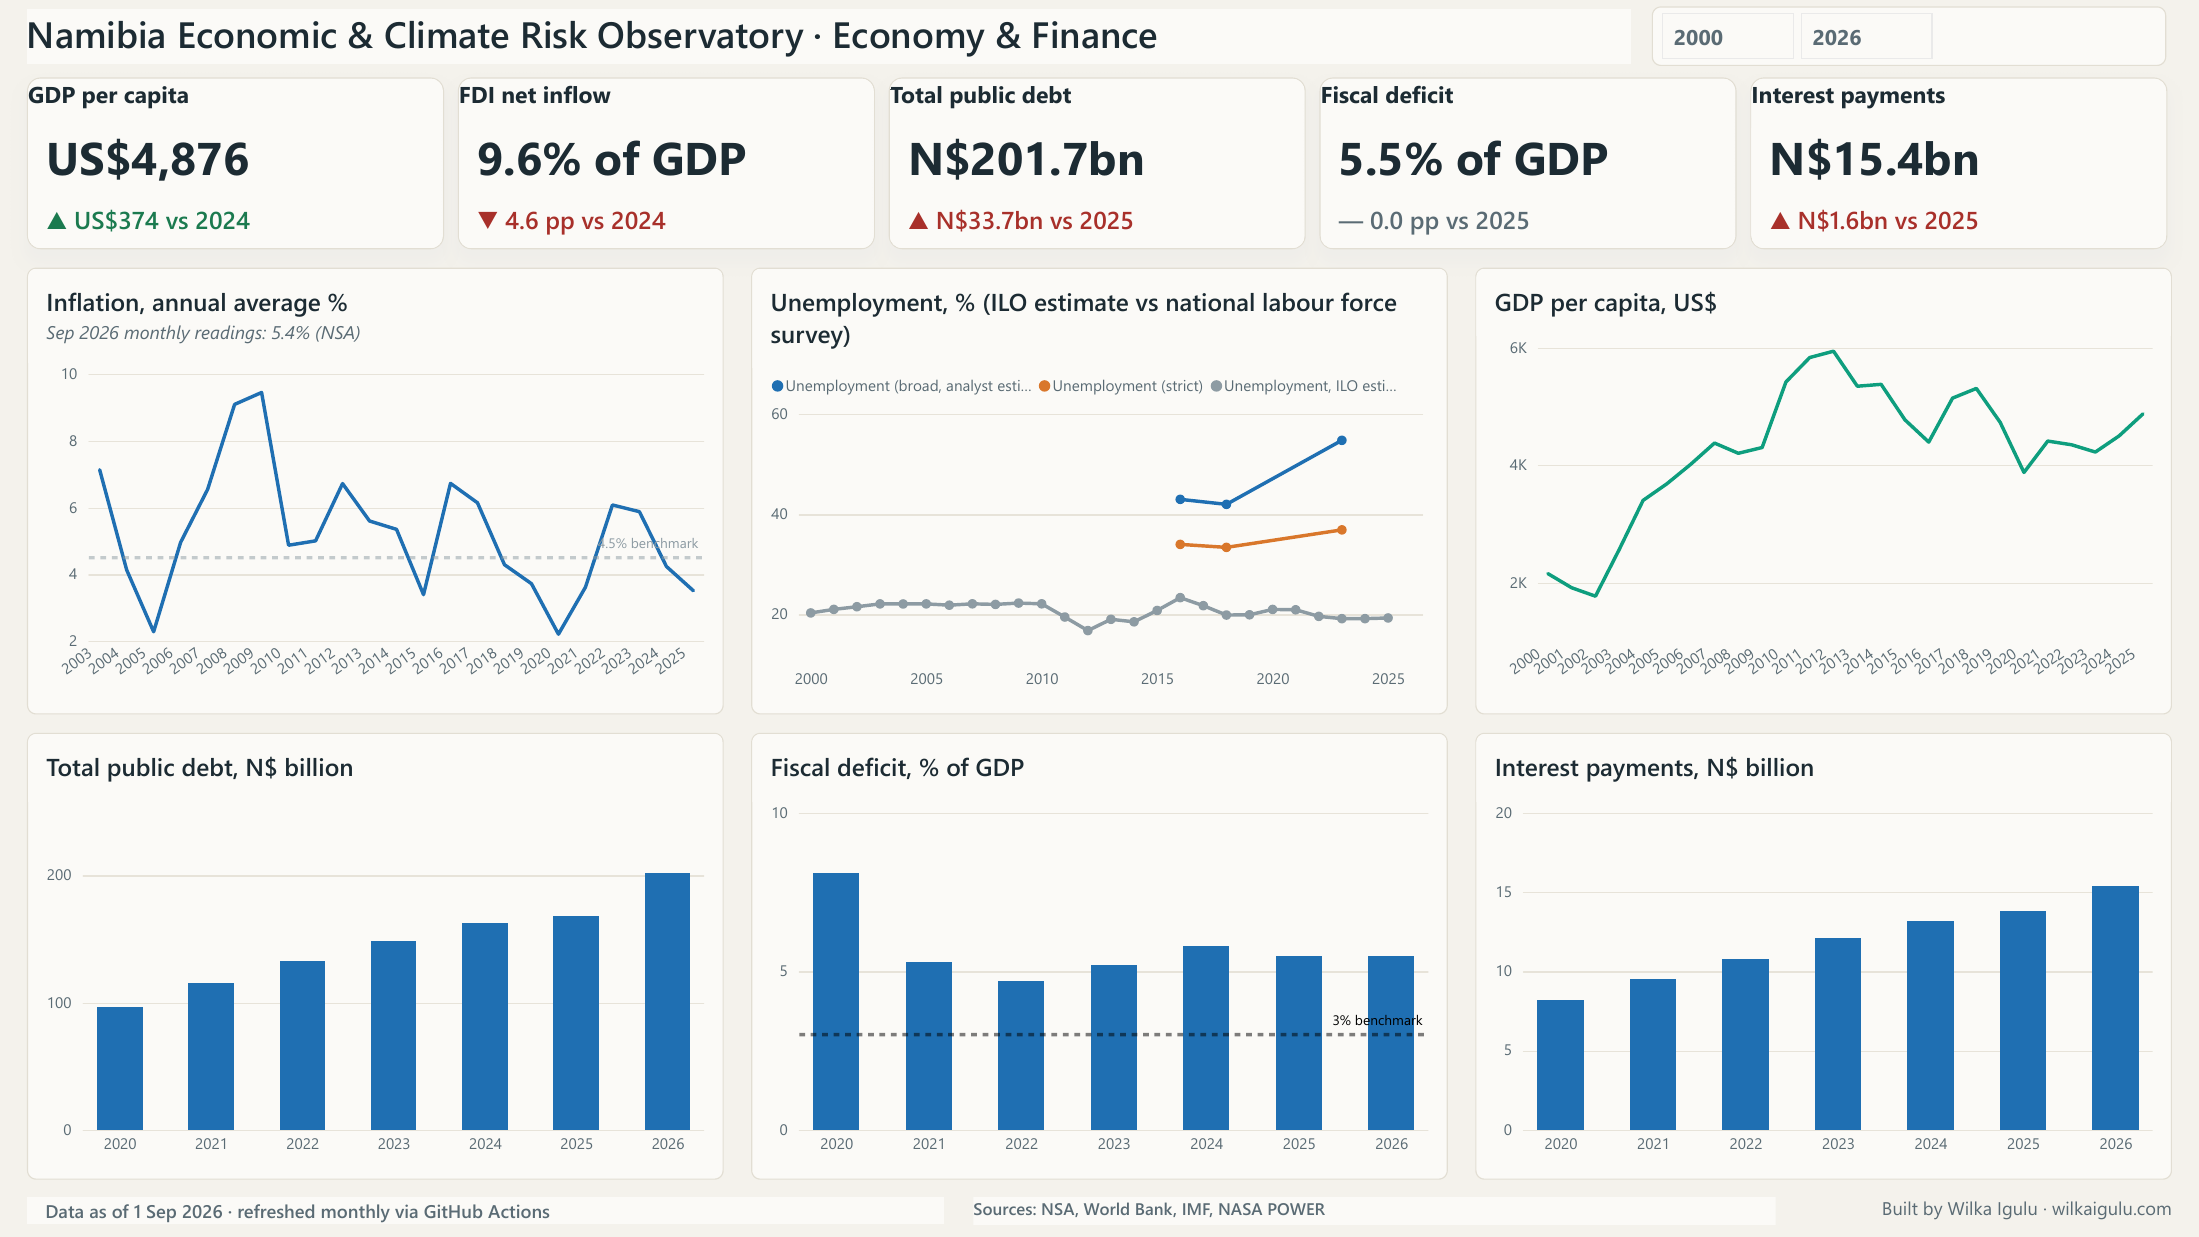
Economy & Finance sets debt, deficit and interest payments against benchmarks, and shows unemployment from three sources, labelled so they cannot be confused.
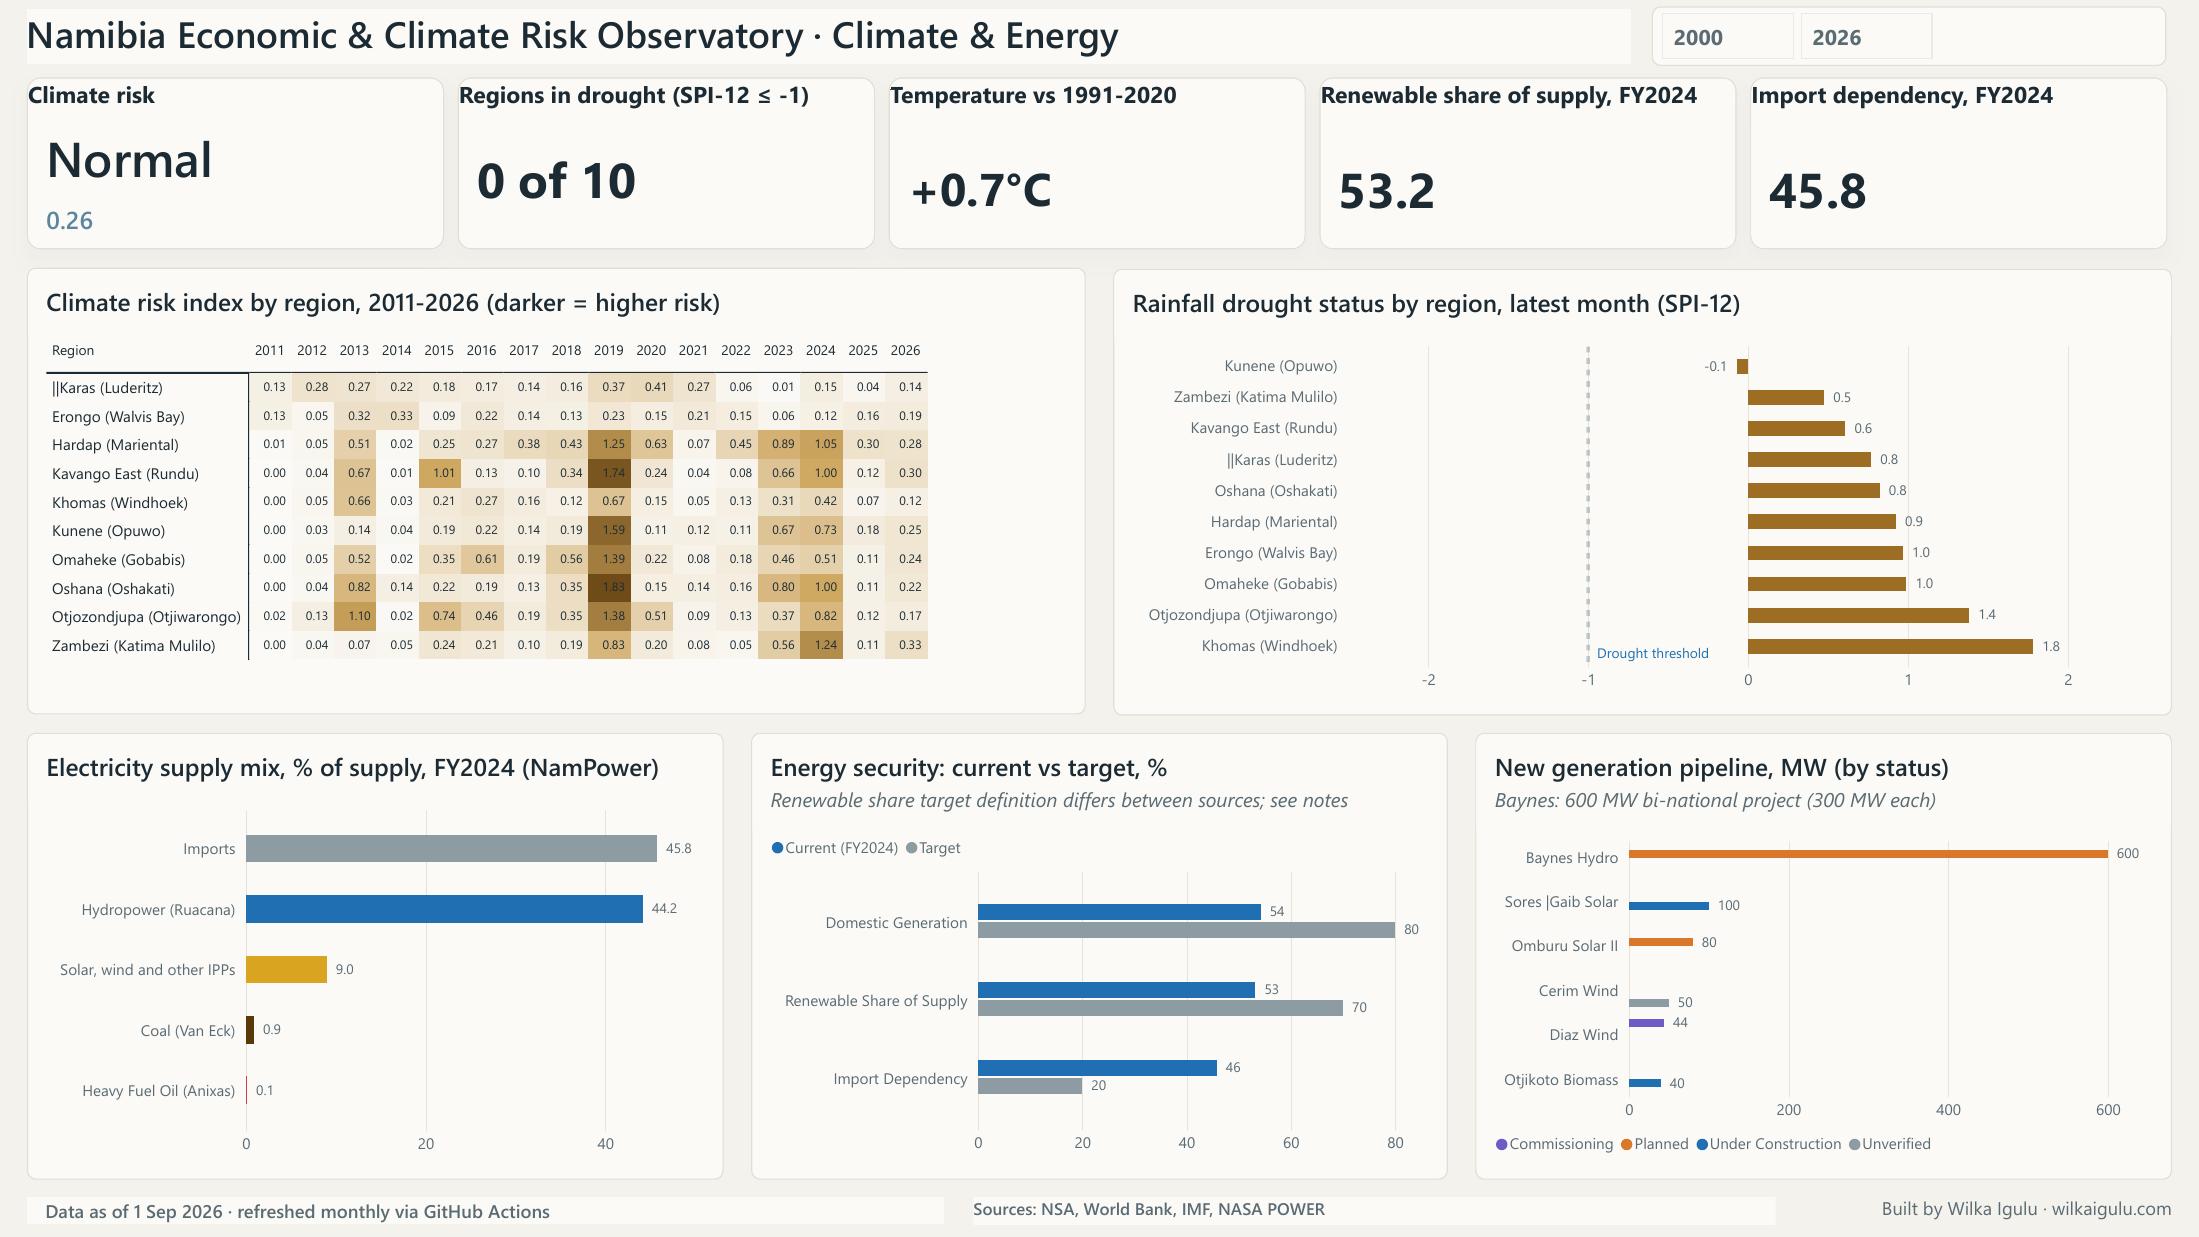
Climate & Energy combines a region-by-year climate risk heat map, drought status by region from the Standardised Precipitation Index (SPI-12), the FY2024 electricity mix and the new-generation pipeline.
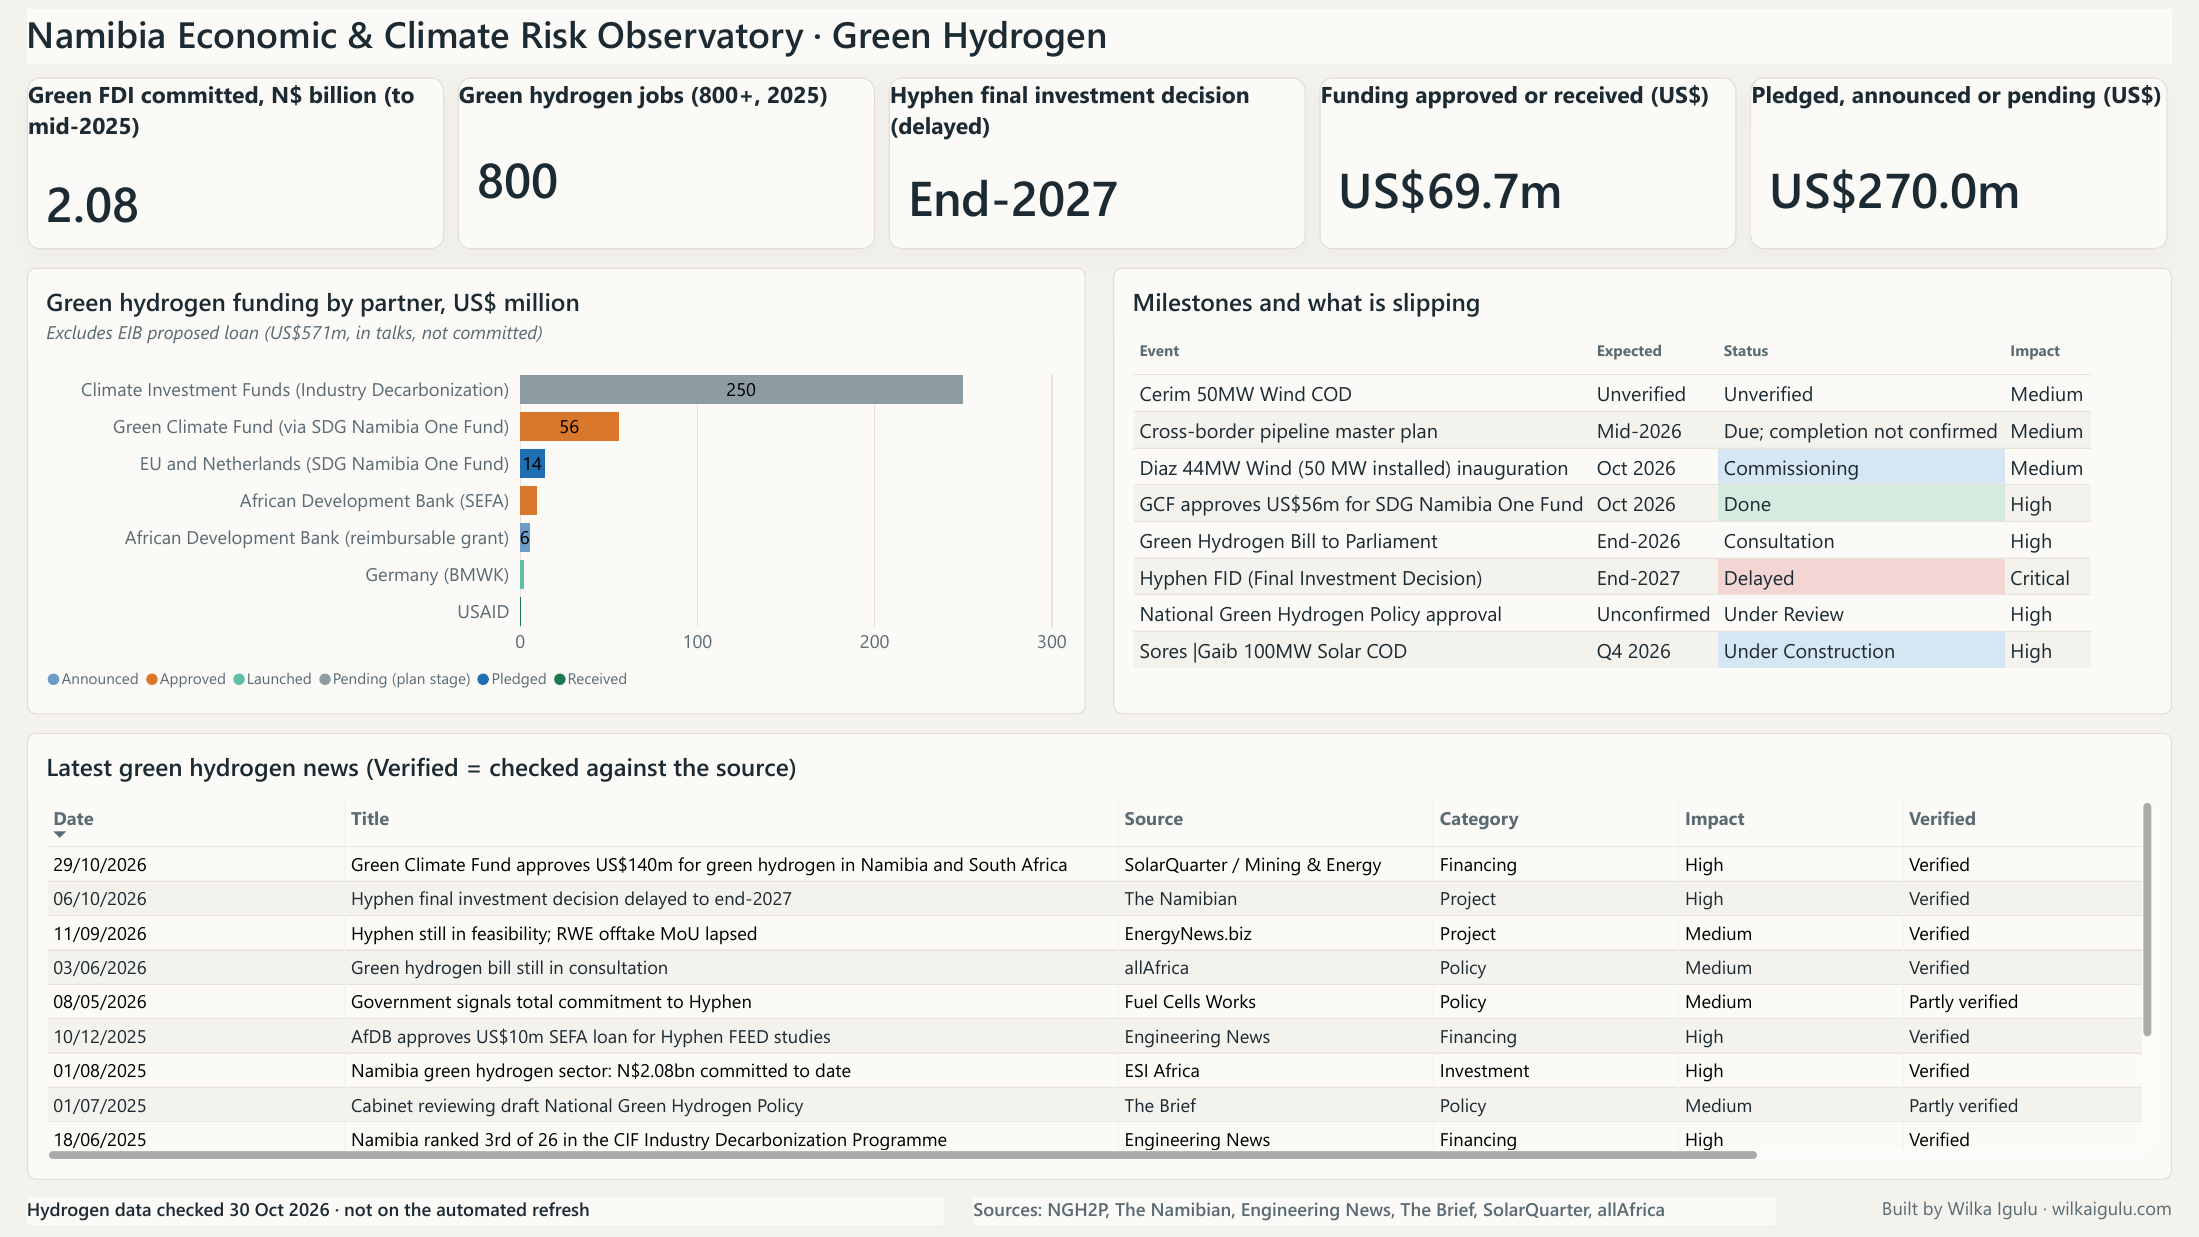
Green Hydrogen separates money that is approved or received from money that is only pledged, announced or pending, and tracks the milestones that are slipping.
How it works
- Python pipeline. Pulls World Bank and NASA POWER data, computes SPI-based climate risk for ten regions, and builds a star schema: two fact tables and three dimensions.
- A quality gate that fails closed. Every run checks schema, plausible ranges, staleness and that every series the report depends on is present. If a check fails, the run stops and the last good warehouse stays in place.
- Power BI. Reusable DAX measures, a light and dark theme, unit-aware tiles and direction-aware colours.
- Automation. GitHub Actions refreshes the national and climate data on the first of each month. A CI check lints the code and rebuilds the warehouse on every change.
A polished dashboard with stale numbers is worse than none.
What I corrected along the way
Before publishing, I audited every figure against current sources, and several of my own numbers changed. Debt rose to 68.7% of GDP in the October review. A green-investment figure I had carried had no source behind it and was replaced by one that does. Projections that fell below the latest outturn were dropped rather than shown as a forecast.
Where two numbers cannot be compared, the report says so. Namibia's labour-force survey changed its definition of unemployment between 2018 and 2023, so the report shows the official 2023 rate and no year-on-year change. A higher "broad" figure is an analyst estimate on the old definition and is labelled that way.
Limits
Only the World Bank and NASA POWER data refresh automatically. Debt, inflation, unemployment, the electricity tables and the green hydrogen tables are curated by hand from official releases, and each hydrogen row carries a source and a verification flag. Items I could not fully confirm are marked "Partly verified" or "Unverified". The hydrogen page is not on the automated refresh and says so.